


Economic inequalities increased in Greece in 2021, according to Hellenic Statistical Authority-ELSTAT.
Income Inequality Indicators
Income quintile share ratio (S80/S20 ratio)
The income quintile share ratio, or S80/S20, measures relative inequality in income distribution, compares the total of equivalent disposable income received by the 20% of the country’s population with the highest equivalised disposable income (top inter-quintile interval) to that received by the 20% of the country’s population with the lowest equivalised disposable income (lowest inter-quintile interval) and is affected by the extreme values of income distribution.
In 2021 the S80/S20 ratio, with reference income period the year 2020, recorded an increase of 0.6 percentage units compared with 2020 (with reference income period the year 2019)
amounting to 5.8, i.e., the share of the income of the wealthiest 20% of the population is 5.8 times higher than the share of the income of the poorest 20% of the population.
Income inequality, for persons aged 65 years and over is 4.2, recording an increase of 0.2 percentage units compared with 2020 (2020:4.0). The income inequality for persons under 65
years old is 6.4 recording an increase of 0.7 percentage units compared to the previous year (5.7).
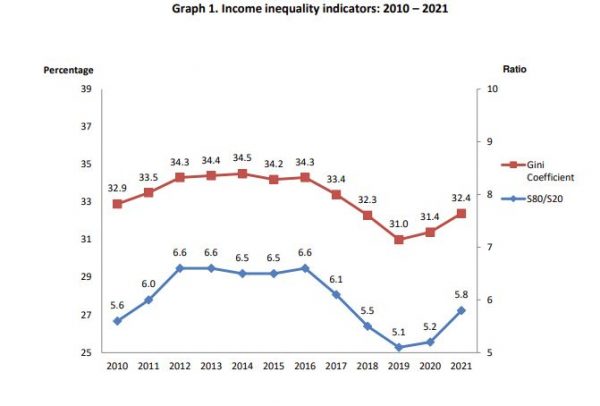
Gini coefficient
In order to depict income inequality more accurately, the Gini coefficient is used complementarily. Ginny coefficient ─ in contrast to the S80/S20 ─ is not affected by the extreme values of income
distribution.
The Gini coefficient is defined as the relationship of cumulative shares of the population arranged according to the level of equivalised disposable income, to the cumulative share of the equivalised total disposable income received by them. If there was perfect income equality (i.e., all persons receive the same income), the Gini coefficient would be 0 (or 0%). A Gini coefficient of 1 (or 100%) indicates that there is total income inequality and the entire national income is in the hands of one person. For example, a Gini coefficient of 30.0% means that choosing randomly 2 persons, the difference between their incomes are at 30.0% of the mean equalized disposable income.
In 2021 the Gini coefficient reached 32.4%, recording an increase of 1.0 percentage point compared with 2020. This means that choosing randomly 2 persons in the population, we expect that their income will differ by 32.4% of the mean equalized disposable income. Since 1994, when the survey began, the overall inequality decreased by 5.0 percentage points (37.4% in 1994).
Severe material and social deprivation
The percentage of the population that lacks at least 7 out of 13 goods and services (i.e. the index that calculates the “percentage of the population with severe material and social deprivations – Europe 2030”) amounts to 13.9%, while the percentage of the population that lacks at least 4 out of 9 goods and services (i.e. the index that calculates the “percentage of the population with severe material deprivation – Europe 2020”) amounts to 14.8%.
Graph 1 shows the evolution of the two indicators for the years 2015-2021
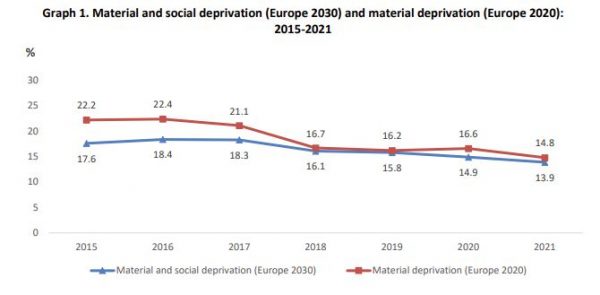
Based on the survey results, a significant decrease is recorded regarding the material and social deprivation among children aged 0-17 years by 6.5 percentage points in 2021 (13.4%) compared to 2020 (19.9%). This decrease is the largest compared to the rest of the age groups. As regards the material and social deprivation in the age group of people aged 65 and over, a decrease by
0.3 percentage points is recorded in 2021 (10.3%) compared to 2020 (10.6%) which is the smallest compared to the rest of the age groups. In 2021, 14.6% of the population aged 18-64 years was in severe material and social deprivation, decreased by 0.7 percentage points compared to 2020.


![Οι 10 εταιρείες με τα μεγαλύτερα ταμειακά διαθέσιμα στον κόσμο [γράφημα]](https://www.ot.gr/wp-content/uploads/2026/07/cash-1.png)